When you're dealing with numbers, it's easy to feel like you're stuck in a maze. One minute, you think you understand everything, and the next, you're second-guessing every formula. Standard deviation is one of those topics that can either make you feel confident or completely confused. But here's some good news: when you know how to calculate it in Excel and Google Sheets, it becomes way less intimidating and way more useful. Let’s break it down in a way that actually makes sense.
What Is Standard Deviation and Why It Matters
In simple terms, standard deviation tells you how spread out your data is. If the numbers in your list are all close to each other, you’ll get a small standard deviation. If they’re scattered all over the place, you’ll get a bigger one.
Think about a classroom test. If every student scores between 85 and 90, the standard deviation will be low. However, if some students score 50 and others score 100, the standard deviation will be much higher. This number gives you a quick snapshot of how consistent (or not) your data is.
Understanding standard deviation matters because it shows you more than just an average. A simple average might tell you the "middle" of the data, but it doesn’t tell you how crazy or steady the results are. Standard deviation fills that gap.
How to Calculate Standard Deviation in Excel
Excel makes calculating standard deviation feel almost too easy once you know where to look. Here’s a simple step-by-step:
Enter Your Data:
Start by typing your numbers into a column. Just make sure they're clean and lined up properly—no empty cells in between.
Choose the Right Formula:
Excel actually offers a few different options:
- =STDEV.P() is for when you have the entire population.
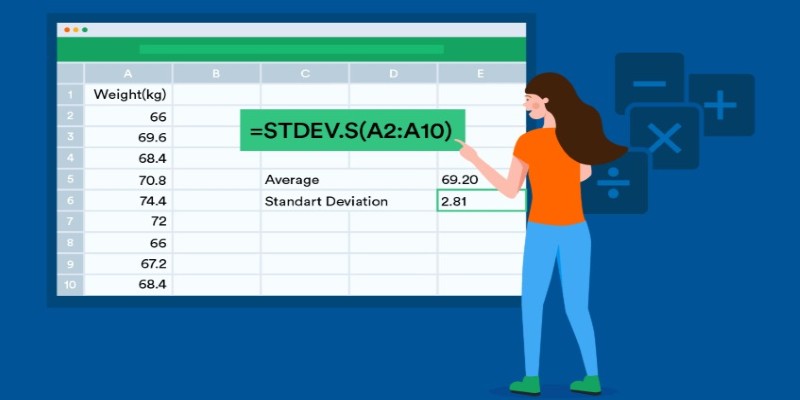
- =STDEV.S() is for a sample of a population.
Most of the time, you’ll be using STDEV.S() because you’re usually working with just a piece of a bigger group.
Apply the Formula:
Click into an empty cell, type the formula, and select the cells that have your data. For example, if your data is in cells A1 through A10, your formula would look like this:
=STDEV.S(A1:A10)
Press Enter:
That's it. Excel instantly gives you the standard deviation. No manual calculations. No guessing.
Quick Tip:
If you ever forget which one to use—sample or population—hover over the function name in Excel. It shows a small explanation that can refresh your memory.
How to Calculate Standard Deviation in Google Sheets
Google Sheets works almost the same as Excel when it comes to standard deviation. The layout looks a little different, but the formulas are practically identical.
Here’s how you can do it:
Input Your Numbers:
Same idea here—get all your numbers into a column without any gaps unless you mean for them to be there.
Pick Your Formula:
Google Sheets gives you:
- =STDEVP() for the full population.
- =STDEV() for a sample.
Just like Excel, you’ll usually be using =STDEV() because most of the time, you're dealing with samples, not entire populations.
Use the Formula:
Click an empty cell, type in the formula, and highlight the range of your data. For example:
=STDEV(A1:A10)
Hit Enter:
Google Sheets does the math for you instantly.
Quick Tip:
If you prefer not typing formulas, Sheets has a shortcut. Click "Insert," go to "Function," then to "Statistical," and you'll find the standard deviation listed there. One click, and it drops the formula right into your sheet.
Common Mistakes to Watch Out For

Even though the process is easy, there are a few things that can trip you up if you’re not careful:
Using the Wrong Formula:
It's easy to mix up STDEV.S and STDEV.P or STDEV and STDEVP. Always check if you're working with a sample or the entire population before choosing your function.
Including Text by Accident:
If you accidentally select a cell with text or a blank cell, it might mess up your calculation or give you weird results. Make sure your range is all numbers.
Merging Data Without Checking:
If you're combining numbers from different sheets or copying from other sources, double-check that everything is pasted correctly. Hidden spaces or errors can cause trouble.
Assuming It’s Always Needed:
Standard deviation is helpful, but it's not always necessary for every set of data. Sometimes, a simple range (difference between the highest and lowest numbers) gives you all the info you need.
Calculating Over Filtered Data Wrongly:
If you filter a sheet and then calculate standard deviation without using a special formula like SUBTOTAL, Excel, and Sheets might still consider hidden rows. You might end up with a number that doesn't make sense for just the visible data.
Forgetting to Handle Outliers:
Huge outliers (like one wrong extra zero) can throw your standard deviation way off. Always take a quick look at your data for any numbers that feel "too big" or "too small" before calculating.
Selecting Uneven Ranges:
Sometimes, people drag and select their data too quickly and pick extra blank cells or miss some numbers. This changes the output without you realizing it.
Not Updating Formulas After Editing Data:
If you add or delete numbers later, but your formula is stuck in the old range, your standard deviation will be outdated. Always double-check that your formula still covers all your intended data after making edits.
Conclusion
Learning how to calculate standard deviation in Excel and Google Sheets is one of those skills that seems small but ends up making a huge difference. Once you get used to it, you’ll wonder how you ever analyzed data without it. It’s a quick, easy way to get a real feel for how steady—or wild—your numbers actually are.
And the best part? You don't have to memorize complicated formulas or do manual math. With a few clicks of a simple formula, you have everything you need to understand your data in a deeper way.